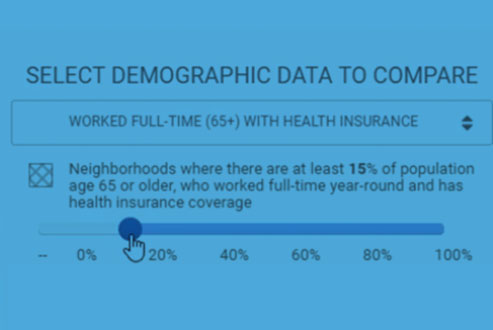
Utilize additional features that enhance the user experience, including the slider function to display two variables simultaneously and the Print Map and Share Map buttons. In the slider function, located below “Select Demographic Data to Map”, choose an additional demographic data point to map. Move the blue slider button on the number scale. The map […]
Uncategorized
Reset All and Search Functions
Clear all selected data from the map and use the search function to find a data point. On the top right corner, above “Add Services and Resources to Map”, click on Reset All to bring the map back to the default setting. In the “Add Services and Resources to Map” and “Select Demographic Data […]
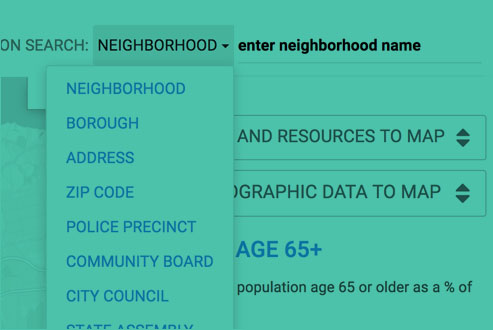
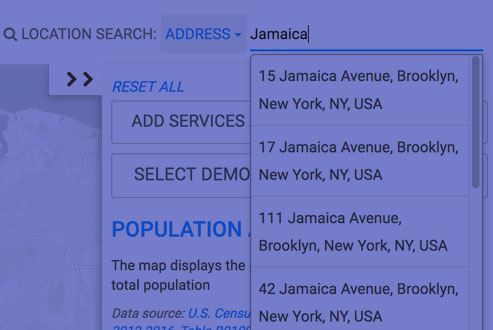
Location Search
Choose the location that you want to zoom in on, by type of location. On the righthand side of the top bar, click on the down arrow next to “Neighborhood” Select the type of location you are looking for, including neighborhood, zip code, and legislative district Begin typing the location in and select the correct […]
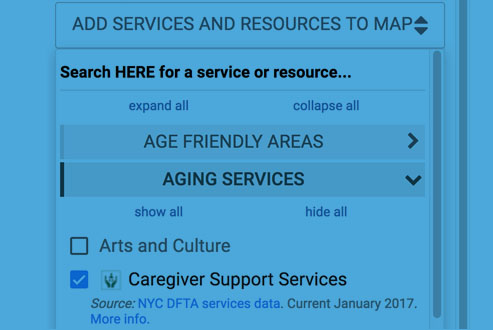
Services and Resources
Map the location and contact information for services and resources that serve older adults. On the top right corner, click the down arrow on “Add Services and Resources to Map” Select the category of Services and Resources Check the box(es) of the information you are looking for The map will populate with icons Click on […]
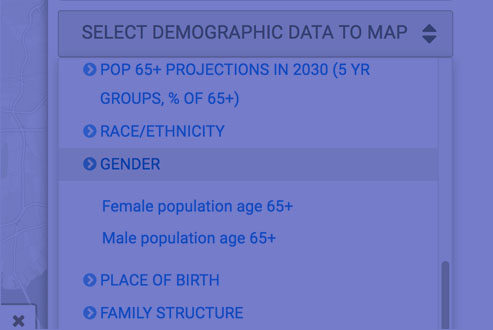
Demographic Data
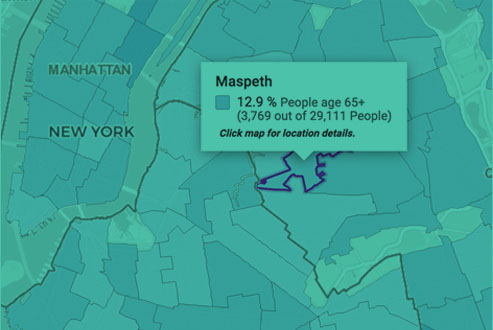
Map demographic data points about adults 65+ in New York. On the top right corner, click the down arrow on “Select Demographic Data to Map” Select the category of demographic data Scroll down to find and select the specific information you are looking for The map will display light-to-dark intervals of a designated color to […]
Overview
IMAGE:NYC, the interactive map of aging, is an open-source, interactive map of New York City’s current and projected population aged 65 and older with overlays of resources, services, and amenities, by neighborhood. The two main categories to choose from are on the top right, “Add Services and Resources to Map” and “Select Demographic Data to […]